
Making lives better by securing growth and benefits for a sustainable future
Fund growth from UGX 13.28Tn to UGX 15.56Tn
17.13% growth
CHIEF INVESTMENT OFFICER
Gerald Paul Kasaato
Material Matters
Strategic Objectives
Stakeholders
Capitals
Risks


On behalf of the Fund’s investment team, I am pleased to report on the investment performance and initiatives for the one-year period ending 30 June 2021. The Fund earned a time-weighted total rate of return of 15.91% over the year, with assets under management (AUM) of UGX 15.56 Tn. Considering the impact of the Covid-19 pandemic on financial markets, it was a commendable performance. It is now the sixth of the 10-year strategic plan, and the Fund continues to grow in all dimensions. The engine for the growth has been as a result of the following:
Good performance despite the enduring effects of the Covid-19 pandemic
A total portfolio return performance of 15.91% with the Covid-19 pandemic far from being contained, and the country witnessing an aggressive variant, is remarkable. This translated into a total comprehensive income of UGX 1.84 Tn compared to UGX 1.47 Tn in the previous year. The 12-month returns were led by equity investments, which generated a 19.1 % return, fixed income investments 16%, while real estate returns came in at 8%. The performance of the equity returns over the 1-year period to 30 June 2021, compared to some other markets in Africa (excluding South Africa) and frontier market bechmarks as depicted in Figure 1 below:
Figure 1: How the fund's equity return compares with different markets over the one-year period to 30 June 2021
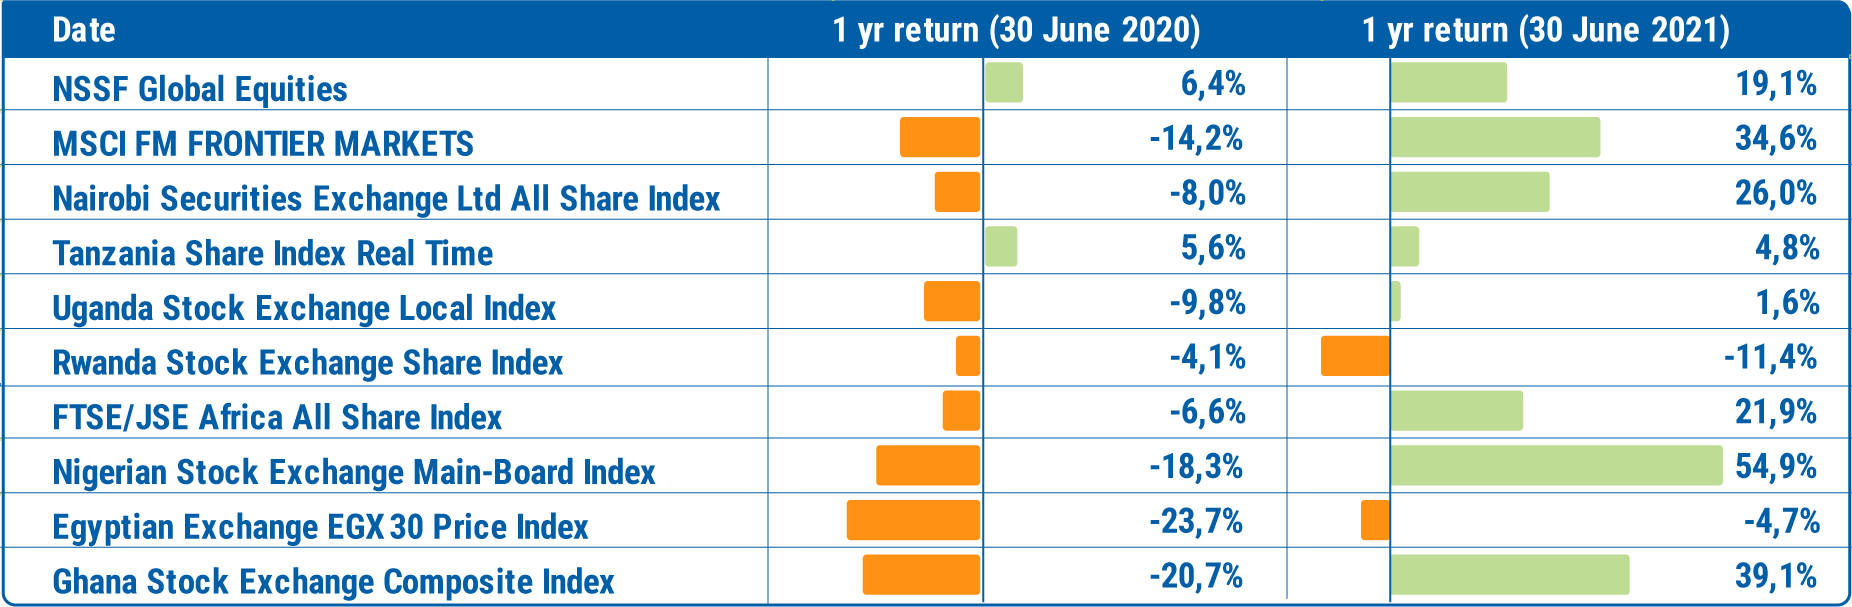
Source: Bloomberg
The year on year performance of the equity markets to 30 June 2021 justifies our diversification strategy. Despite the dismal performance on the Uganda Securities Exchange, Daresalaam Stock Exchange and the Rwanda Stock Exchange, the overall portfolio managed to register an impressive performance on the Narobi Stock Exchange and also benefited from robust stock selection and country weighting. This was despite a currency appreciation of the Uganda Shilling against regional currencies and the US dollar, something that had a drag on returns.
Emphasis on long-term sustainability
It is important to note that, while the strong positive returns are encouraging in a period of uncetainity in many of our local markets and projections of doom in many parts of the world following the pandemic, especially given the slow progress of vaccination, our focus is always on the long-term sustainability of the Fund. The Fund invests for decades to match its liability profile, not a single year. To this end, one-year returns are just part of the results picture for a retirement scheme like ours. Even returns over 3 years (14.25% annualised return), 5 years (15.06%) and 7 years (15.16%), as shown in Table 1 below, represent only short- and intermediate-time periods for measuring results. When we consider the results over 10 years (15.06%) or 15 years (13.85%), the outcomes have a greater bearing on the retirement benefits we can sustainably provide.
Table 1: A review of the historical return performance
| Periods Through 30/06/2021 | The fund's Investment Total/Annualised Average return |
Average 10-year/Annualised Average inflation | Average 10-year inflation + 200 basis points | Interest to Members |
| 1 year | 15.91% | 5.43% | 7.43% | 12.15% |
| 3 Years | 14.25% | 5.76% | 7.76% | 11.25% |
| 5 Years | 15.06% | 6.43% | 8.43% | 11.99% |
| 7 Years | 15.16% | 6.84% | 8.84% | 12.06% |
| 10 Years | 15.06% | 7.31% | 9.31% | 11.72% |
| 15 Years | 13.85% | 7.06% | 9.06% | 10.28% |
| 3-Years after 2008 | 8.80% | 10.30% | 12.30% | 5.33% |
Source: Internal
During the year we also managed to generate meaningful income from the real estate asset class from the sale of Citadel apartments at Mbuya (UGX 13 Bn) and Yusuf Lule land (UGX 25 Bn). Compared to previous years, this was remarkable.
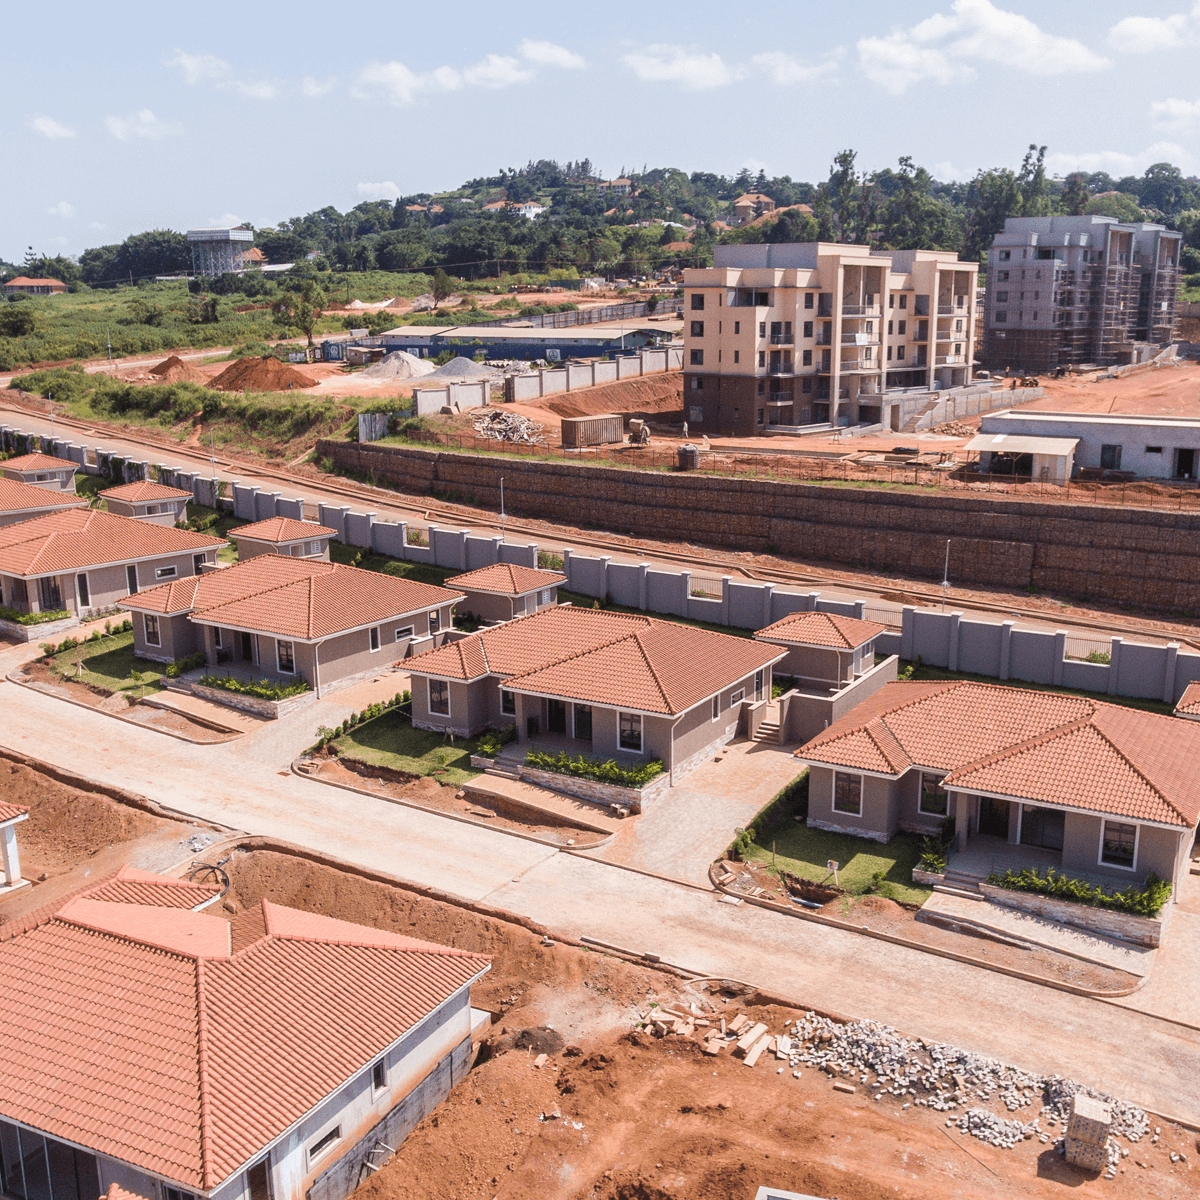
The real estate return of 8% is closer to the double digit target which is our aim for the asset class going foward. This will be achieved by unlocking the value of land through build and sale of residential estates and completion of existing commercial and office projects.
The downside: increase in regulatory costs , the appreciation of the Uganda Shilling, low compliance and slow progress on projects
The impressive performance did not come without challenges. Let us explore the major ones.
Increasing scheme license fees
The fees paid to the regulator have continued to grow with the assets.
In the financial year 2019/2020, the Fund paid UGX 6.5 Bn and this is expected to grow to over UGX 7.5 Bn for 2020/2021.
Figure 2: The Fund's payments to URBRA for the scheme license over the years
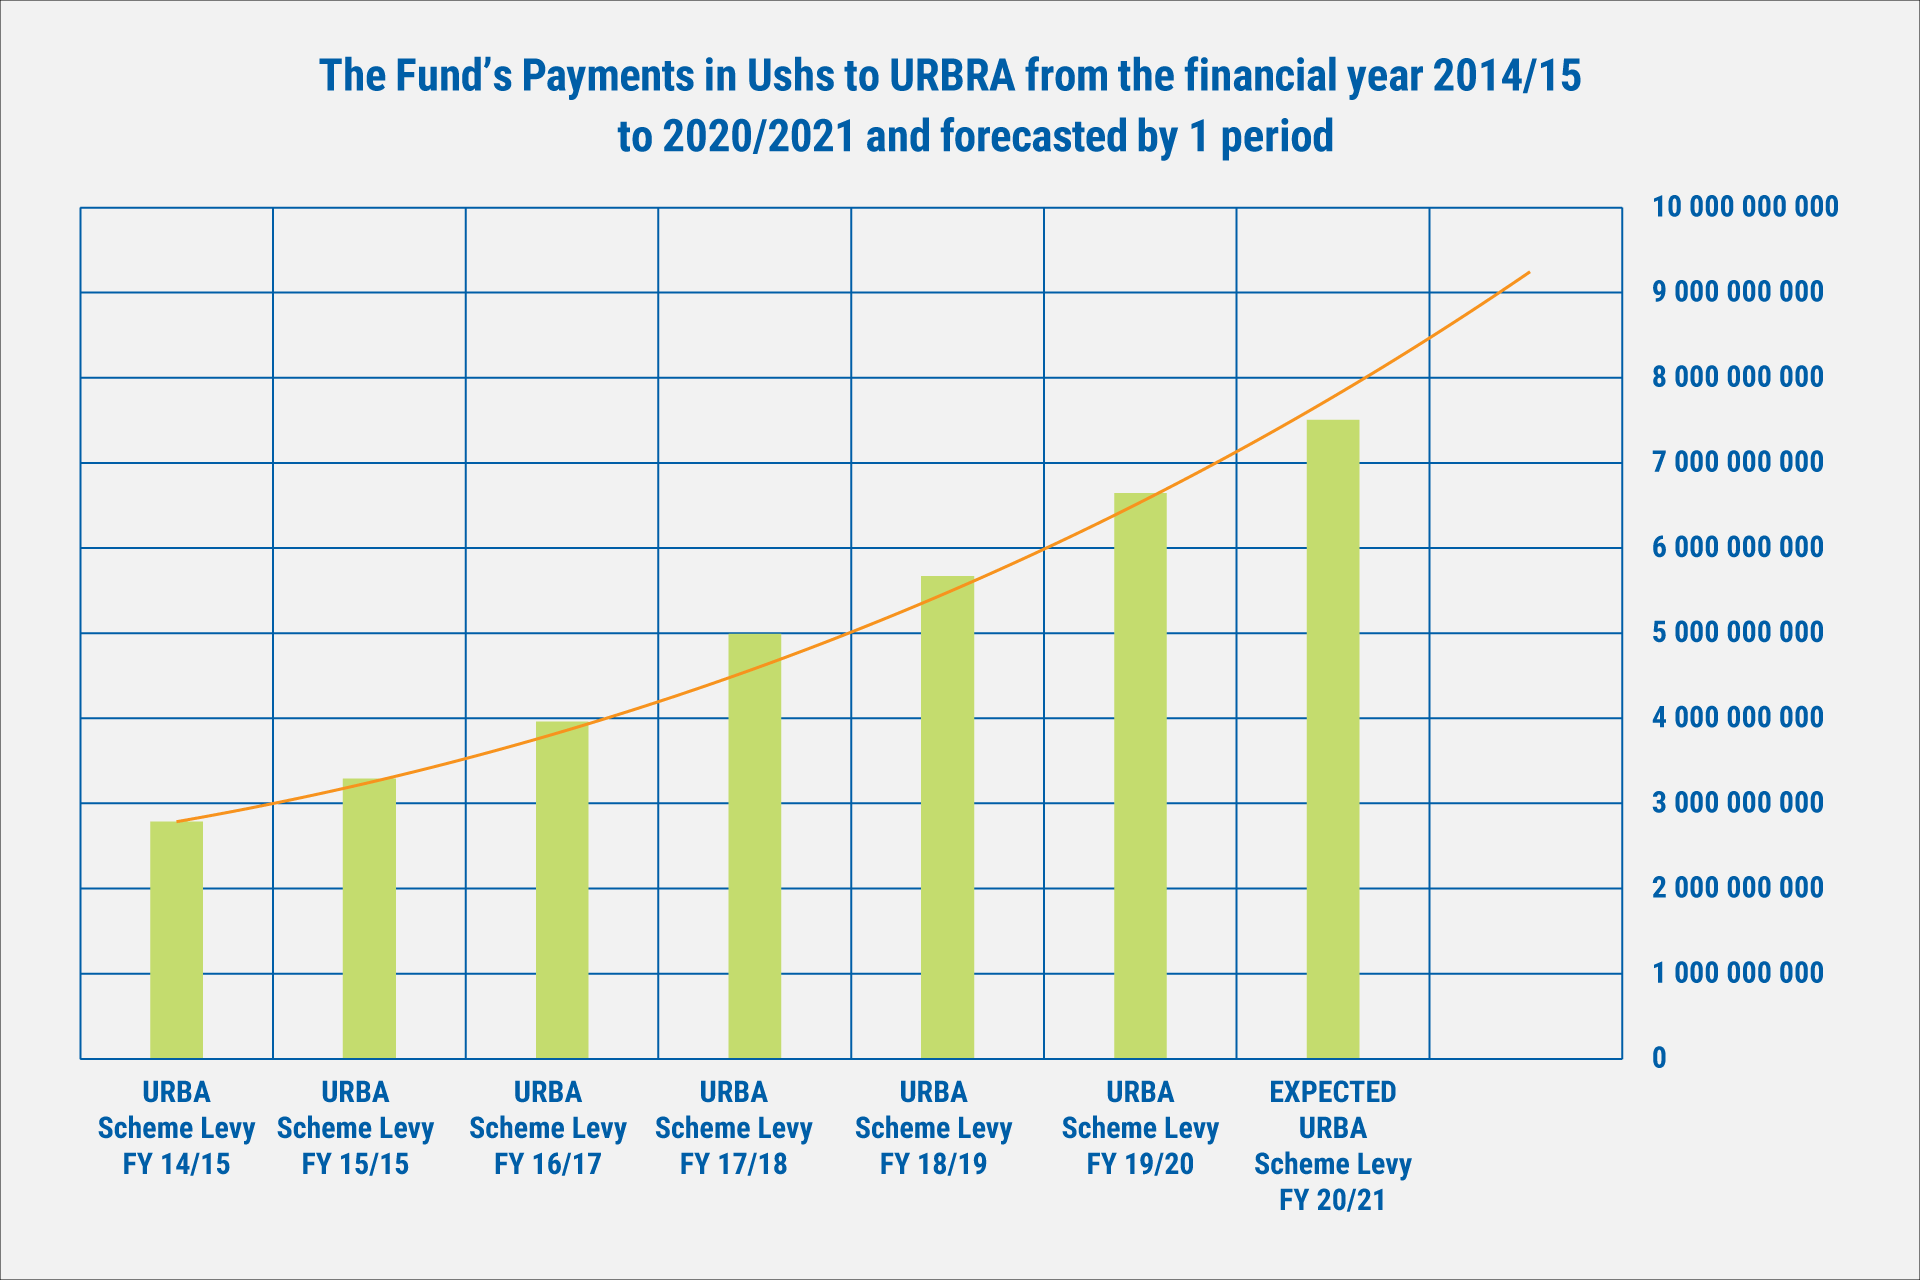 Source:Internal
The increase in fees is a drag on the return paid to members. Moreover, the percentage growth in the fees is more than the overall growth in the operating expenditure of the Fund. It is expected to grow more.
Impact of a strong Uganda Shilling
During the fiscal year, the Uganda Shilling appreciated against all the other portfolio currencies as follows: 6.1% to the KES, 4.8% to Tanzania Shillings, 4.7% to the USD and 9.9% to the Rwandese Franc. This had an impact of UGX 302.22Bn in currency losses. This however, did not impact the overall performance as the losses were more than offset by the equity gains of UGX 410.04 Bn.
Covid-19 impact on compliance, especially the educational sector
The impact of the lockdown to combat the spread of Covid-19 weighed in heavily on compliance rates. This is depicted in Figure 3 and Table 2 below.
Figure 3: The Fund's compliance trend in the last
four fiscal years
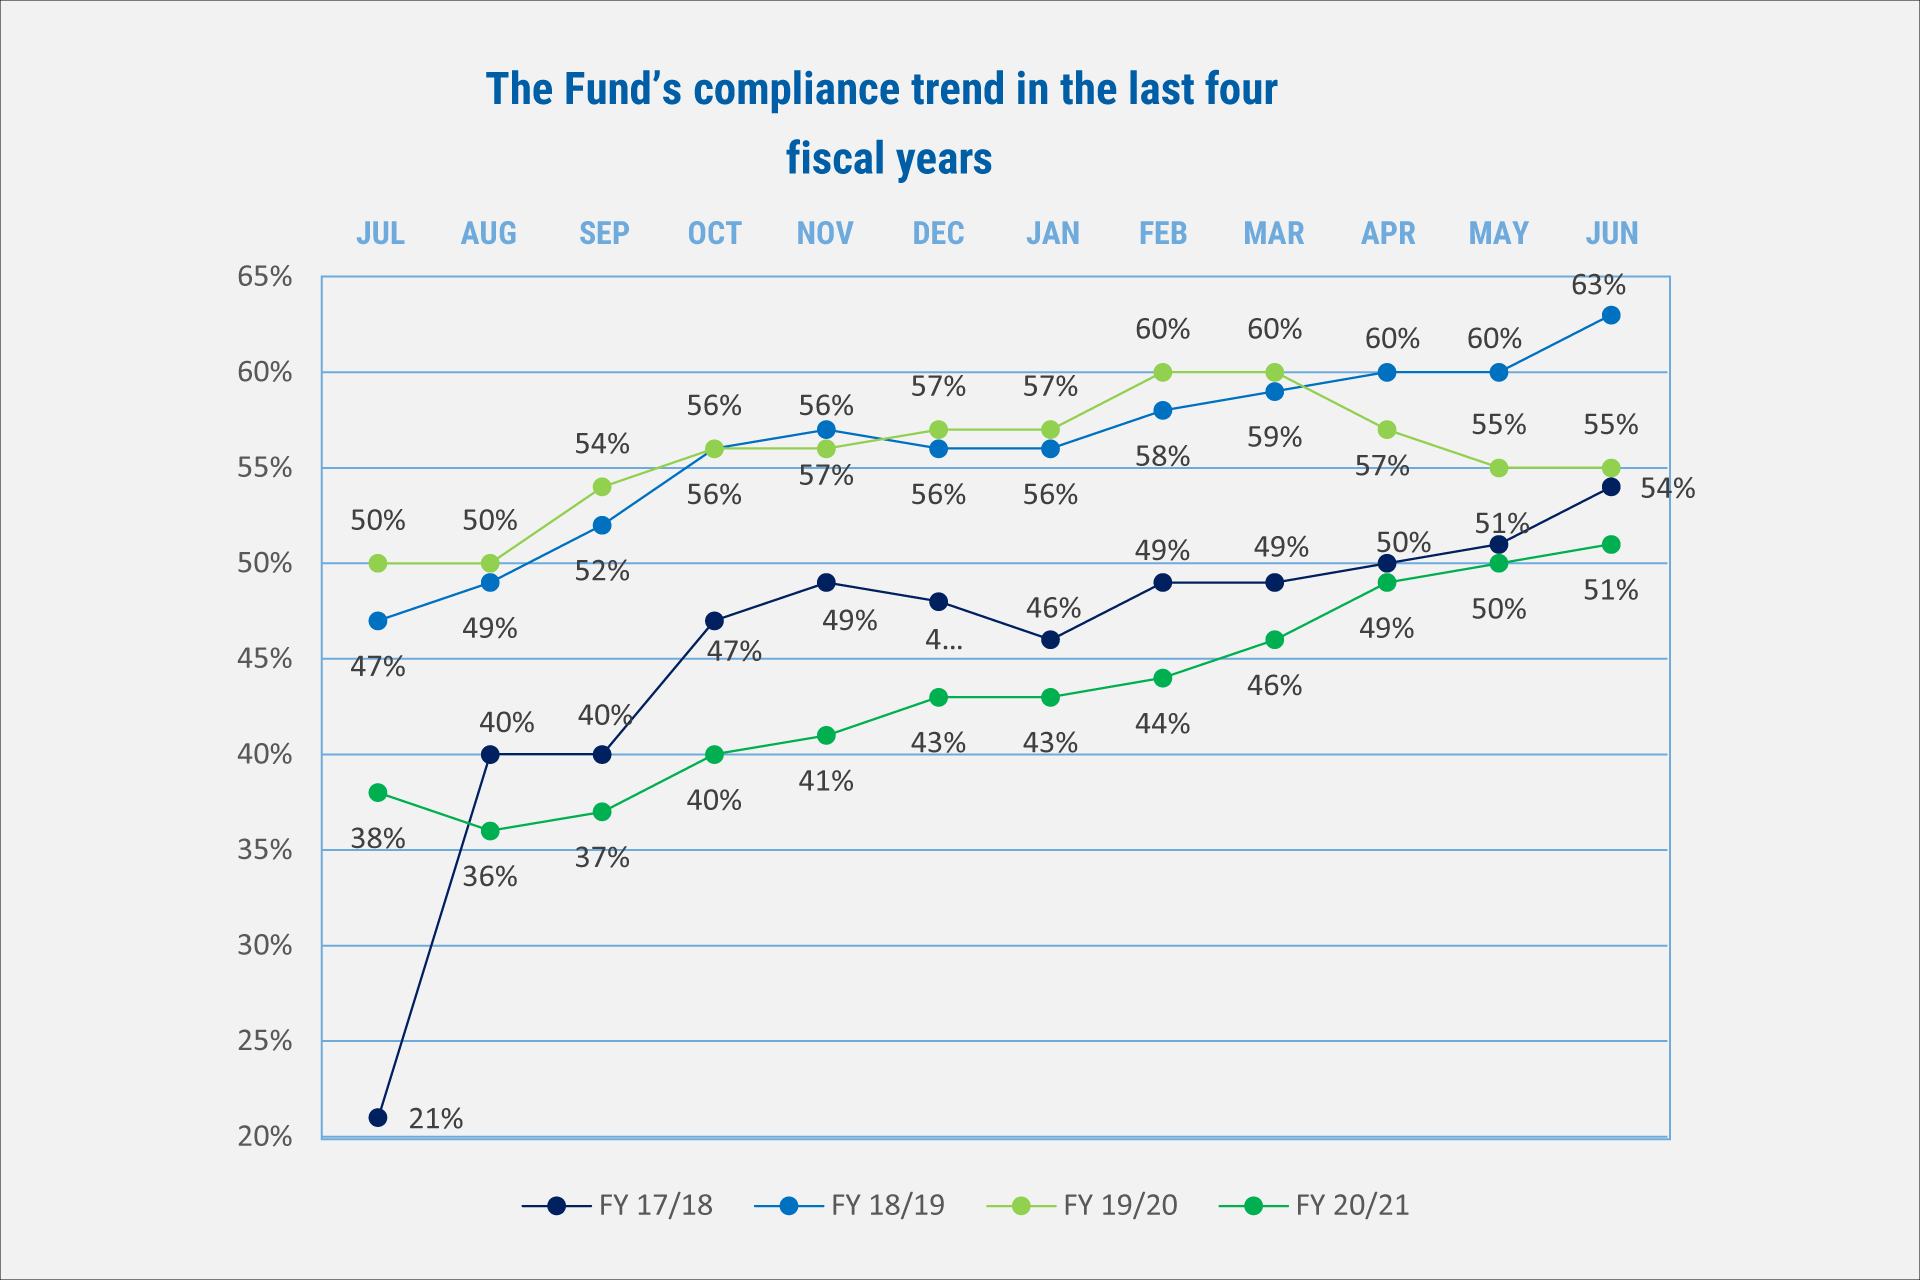 Source: Internal
From Figure 3 above, it is clear that the compliance percentage rate was, on average, lower in the last fiscal year compared to the last three years. When analysed further by sector, as depicted by Table 2 on the right, it is clear that education, tourism and financial services sectors were the hardest hit.
Table 2: The Fund's compliance trend by sector in the last three fiscal years
| Sector | 18/19 | 19/20 | 20/21 |
| Agriculture, forestry and fishing | 71% | 68% | 70% |
| Education | 60% | 37% | 21% |
| Financial & Insurance Services | 81% | 76% | 78% |
| Human health and social work activities | 75% | 71% | 71% |
| Information, Communication & Technology | 57% | 54% | 59% |
| Manufacturing and mining | 77% | 75% | 76% |
| NGO, Political & Trade unions | 77% | 75% | 75% |
| Professional, scientific and technical activities | 64% | 59% | 63% |
| Public administration & security companies | 65% | 64% | 65% |
| Recreation, Accommodation and food service activities | 67% | 55% | 52% |
| Trade | 69% | 66% | 69% |
| Transport & Storage and Real estate activities and construction | 67% | 61% | 64% |
| Utilities and energy | 76% | 75% | 76% |
| Voluntary individuals | 59% | 59% | 55% |
Source: Internal
Impact of Covid-19 measures on investments and real estate projects
Economic activity came to a standstill as governments (except Tanzania) took an aggressive stance to slow the spread of Covid-19 with critical containment actions like lockdowns, in the process breaking up global supply chains.
As a consequence, contributions collections were adversely impacted; something that impacted new money available for investments. To spur a recovery, aggressive fiscal and monetary policy responses have since been undertaken. The results remain mixed.
The lockdown adversely affected projects. Construction works could not progress as fast as we had hoped in the fiscal year. The projects affected included: Lubowa, Temangalo, Pension Towers, Mbale, Gulu and the Off taker.

Opportunities
Despite some of the downside effects, we took advantage of several opportunities.
Recovery of regional equity markets
As explained earlier, regional equity markets recovered despite the dismal performance of the local companies on the Uganda Securities Exchange. We took advantage of the bearish market sentiment at the beginning of the fiscal year, therefore the recovery found us in a good place. The low sentiment at beginning of the fiscal year, occasioned by low activity from foreign investors on the buy side, offered some good entry positions or the opportunity to average down. As a consequence, this resulted in an impressive overall return and better interest to members compared to the previous fiscal year.
This gives credence to the investment strategy that we have adopted over the years: taking advantage of the regional market opportunities at a time when the Uganda Securities Exchange offers few or no attractive opportunities. The result is that over the years, we have managed to build resilience in the overall portfolio performance, irrespective of the times.
The merger of the NARO scheme assets and liabilities into the Fund
In the fiscal year ended, the Fund managed to merge with the National Agricultural Research Organisation (NARO) Retirement Benefits Scheme. The Assets Under Management (AUM) of the latter of UGX.42.9 Bn are now integrated into the Fund. The decision by the NARO Trustees to join the Fund, is testimony of the fund's sustainable performance.
Essentially, the merger of the two schemes will have the effect of improving retirement/social security of 835 members who will not only take advantage of good returns, but also better safety of their savings going forward.
This also came with an opportunity to acquire 50 acres of land in Bukerere (next to the NHCC land) which is now part of the land bank. We believe it can be utilised for affordable housing in the future. This is consistent with improving livelihoods.
Extending the yield curve in Uganda and Tanzania
We also took advantage of good yields and the lengthening of the Government of Uganda (GOU) yield curve. The GOU issued a 20-year bond for the first time. To the extent that this had a long way in financing the fiscal deficit (at a time when URA was not meeting its collection targets), we believe it went a long way in improving livelihoods. It also offers credence to the essence of having and preserving a pool of local funds.
Its role in the economy cannot be emphasised enough. We also took advantage of the extension of yield curve in Tanzania to 25 years. The 25-year bond was issued for the first time.
Ugandans employed to work on projects
In spite of the pandemic, our projects provided invaluable employment to over 2,000 Ugandans who work at the different sites. Work at the different sites continued during the lockdown in spite of the challenge of disruptions in supply chains.
We believe that the employment opportunities at the sites go a long way in improving livelihoods.
Although we took advantage of opportunities in a difficult environment, we had to make key trade-offs.
Some of the trade-offs
In the fiscal year, the benefits payments increased significantly to UGX 642.3 Bn compared to UGX 496.4 Bn the previous year, an increase of 29.4%. Indeed, the period from October 2020 to March 2021 saw the Fund make unprecedented monthly payments. Yet, this was a period of good yields in the fixed income asset class in Uganda which accounts for most of the portfolio income; and also coincided with the issuance of the 20-year GOU bond for the first time. Despite the liquidity at Fund level being stretched, we managed to maximize the advantage in the markets by leveraging our partnerships.
Maintaining occupancy levels in a period of lockdown and working from home was a delicate balance. We waived rent and deferred the payment of for some tenants who were hit hard by the lockdown. This has kept our occupancy levels above the sector average in the respective building grades and improved our relationship with the tenants.
The other trade off was the deferral of contributions which was a decision to respond to the hardship that was being faced by several employers. Although it affected compliance levels, several companies managed to keep staff on their payroll thereby sustaining their employment and the contributions we derive therefrom. We believe this also went a long way in maintaining livelihoods.
In-house asset management
During this fiscal year, we conducted an asset allocation and investment strategy review, focusing on our comparative advantages, and eliminating costly fees. This reinforces our stance on keeping external manager asset management relationships to less than 1% of the portfolio, keeping the bulk of the assets under internal management and saving the Fund over UGX 25 Bn (could be more) a year in fees —internal management is less than a third of that cost. We believe that the fund's respected brand allows us to attract, motivate and retain high-calibre investment professionals and operational specialists. It also helps differentiate the organisation in hotly contested markets for select investments.
Real estate and alternatives
Not many schemes have real estate and alternative investments as an asset class because of their inherent risks. We believe that over the years, despite legacy issues, we have built capacity to turn this into a distinct opportunity and advantage for the Fund going forward.
Long term investment approach
We believe in a long term investment approach. The investment team has the scale to engage in almost every capital market and investment opportunity in the East African region. The unique characteristics of the Fund, together with the circumstances that we can benefit from or control, drive our investment strategy. The Fund manages an investment portfolio to meet its current and future obligations over the long term, including paying benefits in a timely fashion, generating real long term annualized returns, and minimising the likelihood of a substantial, sustained drawdown of its assets. Consequently, we can withstand short-term downturns to create value over the long run.
The progress made since last fiscal year is summarised in Table 5 below.
The progress made since last fiscal year is summarised in Table 3 below.
| No. | Item | Progress |
| (a) | Reducing the allocation to fixed income to 70% of the investment portfolio. | This remains largely a work in progress as most of the opportunities to absorb the kind of liquidity of a scheme of our size tend to exist in the fixed income asset class. Nevertheless, we managed to keep the allocation flat at 78%. |
| (b) | Increasing the allocation to equities to 22.5% of the investment portfolio. This will include listed and private equity. | This remains a work in progress. We have managed to keep the allocation flat at 15% through some secondary market opportunities. |
| (c) | Maintaining the allocation to real estate at 7.5% of the investment portfolio. This will include investing in build and sell projects, commercial and mixed-use properties, and land banking. | This was largely achieved. We closed at 7%. There was good progress in selling the Mbuya Citadel units. |
| (d) | Unlocking the value of real estate land by coming up with concepts to have it developed. | This was largely achieved. Progress was achieved on Mbale and Temangalo with signed design and build contracts. We expect to have Gulu and Yusuf Lule Road procurements completed in the new fiscal year. Good progress was also made on the Pension Towers and Lubowa projects. |
| (e) | Diversifying by country (within the investment universe), asset class, sector, currency, and many other risk factors. | This was largely achieved and is consistent with our strategic asset allocation. |
| (f) | Exploring new asset classes that improve the risk return profile of the Fund and working with the regulator to have them cleared. | We have engaged the regulator and other partners on securities lending. Those engagements are ongoing. |
The plans for the year ahead: the macroeconomic and market environment
We remain cautious on the macro environment as many seemingly unharmonious indicators continue to co-exist. On average, we expect the economies of the countries we invest to recover to growth of about 5% with a moderate risk on inflation: within a range of 3% to 6% (with Kenya having the highest). However, we expect inflation in developed markets to stay elevated for now but once some base effects drop out, commodity prices ease, and economies reopen, underlying pressures generally come under control – with the US a key exception.
There is plenty of financial commentary warning about the prospects of inflation getting out of control in developed markets, and economies returning to something like the high-inflation experience of the 1970s. This talk though maybe overdone. Nevertheless, we expect monetary tightening going forward. The gold price and several commodities are also likely to fall over the next eighteen months as US real yields rise and investors intensify their selling of safe-haven assets.
In this current high-yield and mixed-growth environment (in developed markets) and local market largely driven by demand and supply of liquidity, we continue to execute on our strategy to achieve a double-digit return target, as these challenging times require innovation and an understanding of our structural advantages. The impact of this on our investments will depend on how foreign investors react to all of this, considering that their ownership of GOU bonds stood at double digit percentages at the end of June 2021.
Outlook
Our investment management strategy focuses on the following goals:
We then employ a total portfolio investment framework designed to optimally achieve the dual goals. We are committed to the Fund’s mission and aim to achieve attractive returns that, over the long run, will enable us to provide our members with sound returns that empower them to achieve economic security and believe in saving as a way of life. We are also committed to the success and sustainability of our programme.
Our mission remains the same: manage the fund's investment portfolio in a cost-effective, transparent, and risk-aware manner in order to generate returns and create value for members. We are confident that the combination of the Fund’s skilled staff and well-considered investment strategy, will enable the Fund to deliver strong performance over the long term.
Gerald Paul Kasaato
CHIEF INVESTMENT OFFICER
Investment performance explained
During the year, we reviewed our strategic asset allocation (SAA). We believe that maintaining the optimal weight targets at 70%, 22.5% and 7.5% for fixed income, equities and real estate, respectively, is justified. This suggests an overall modest risk profile. The asset mix as at 30 June 2021 and how it compares to the SAA is depicted in table 4 below.
Table 4: The fund's asset mix and how it would compare to the SAA as at 30 June 2021
| No. | Asset Class | Allocation | Performance | Sharpe Ratio |
| 1 | Equities | 15% | 19.1% | 1.45 |
| 2 | Real Estate | 7% | 8.0% | 0.11 |
| 3 | Fixed Income | 78% | 16.0% | 61.29 |
| Total portfolio | 100% | 15.9% | 6.17 |
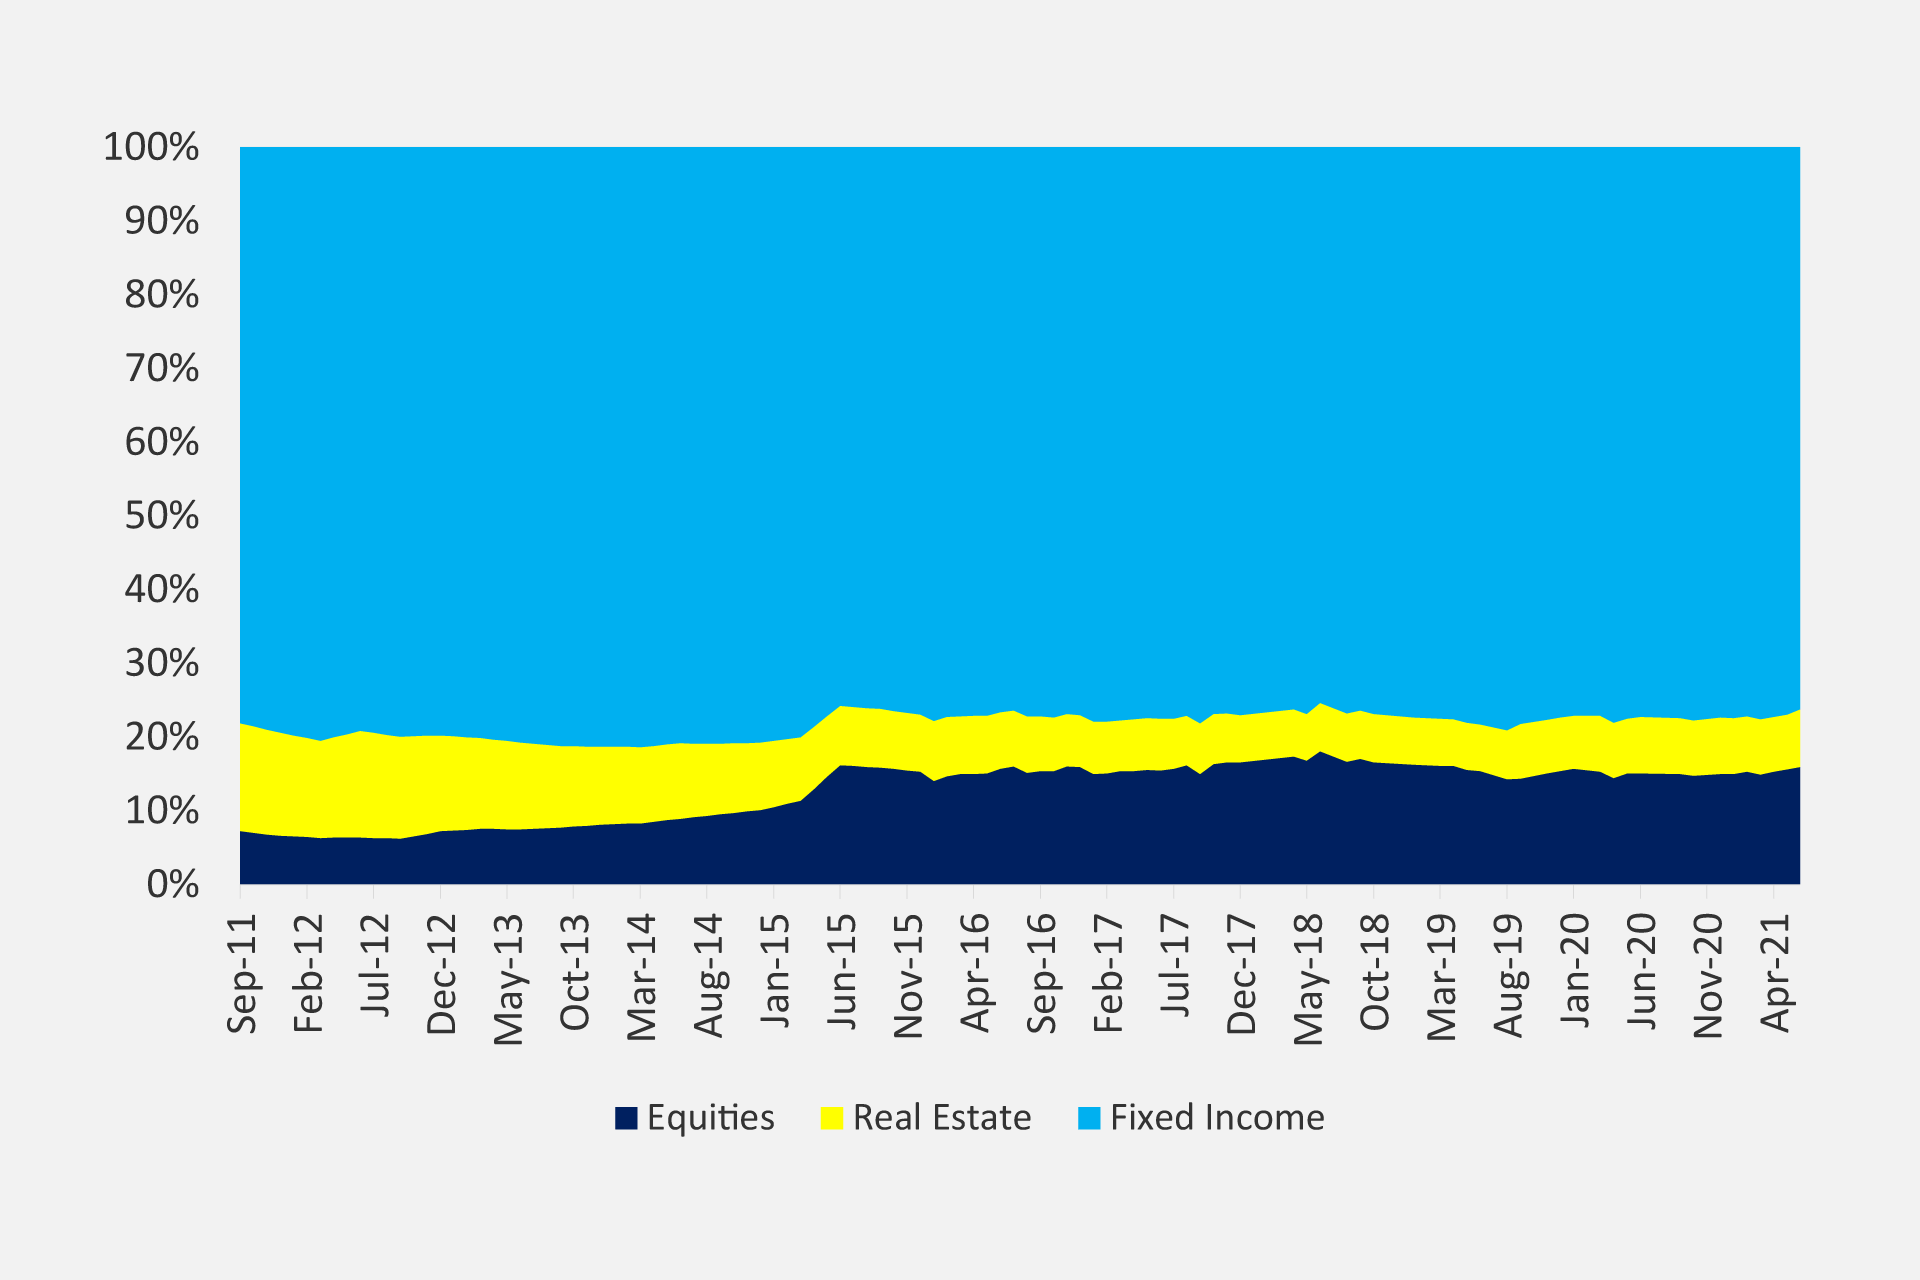
Going forward, we will be reviewing the SAA annually. The asset mix trend over the last ten years is depicted in Figure 4 below.
Essentially, the investment mix has been predominantly skewed towards fixed income. There have been deliberate efforts to diversify the investment portfolio since 2011. This has resulted in more allocation to equities, and a reduction in the real estate allocation. This is mainly attributed to the slow absorption of funds into projects caused by a rather bureaucratic process of procurement and contract management.
Figure 4: The Fund’s asset mix trend for the last ten years
-
We believe that having a moderate risk profile for the asset allocation is reasonable for several reasons:
It recognises the inherent constraint posed by the nature of capital markets where the Fund invests—small, illiquid, concentrated in a few sectors and not deep. We still have few listings on the stock exchanges and the free float of several companies is less than 50%. This is exacerbated by the dominance of the financial services and telecom sector.
-
It recognises the need for sufficient liquidity for asset liability matching needs.
-
It takes advantage of the relatively attractive interest rates and stable inflation in Uganda and the East African region.
-
It augurs well with the investment governance structure.
-
It recognises the need to search for growth of the assets by taking calculated risk. There is no return without risk. We believe that the Fund can earn sufficient risk premiums by leveraging its liquidity and long-term investment horizon.
The investment portfolio is mainly exposed to six risk factors as depicted in Figure 5 below. The exposure to these risk factors has largely stayed the same if you observe the periods of 30 June 2018, 2020 and 2021.
Figure 5: The Fund’s investment portfolio broad risk factors
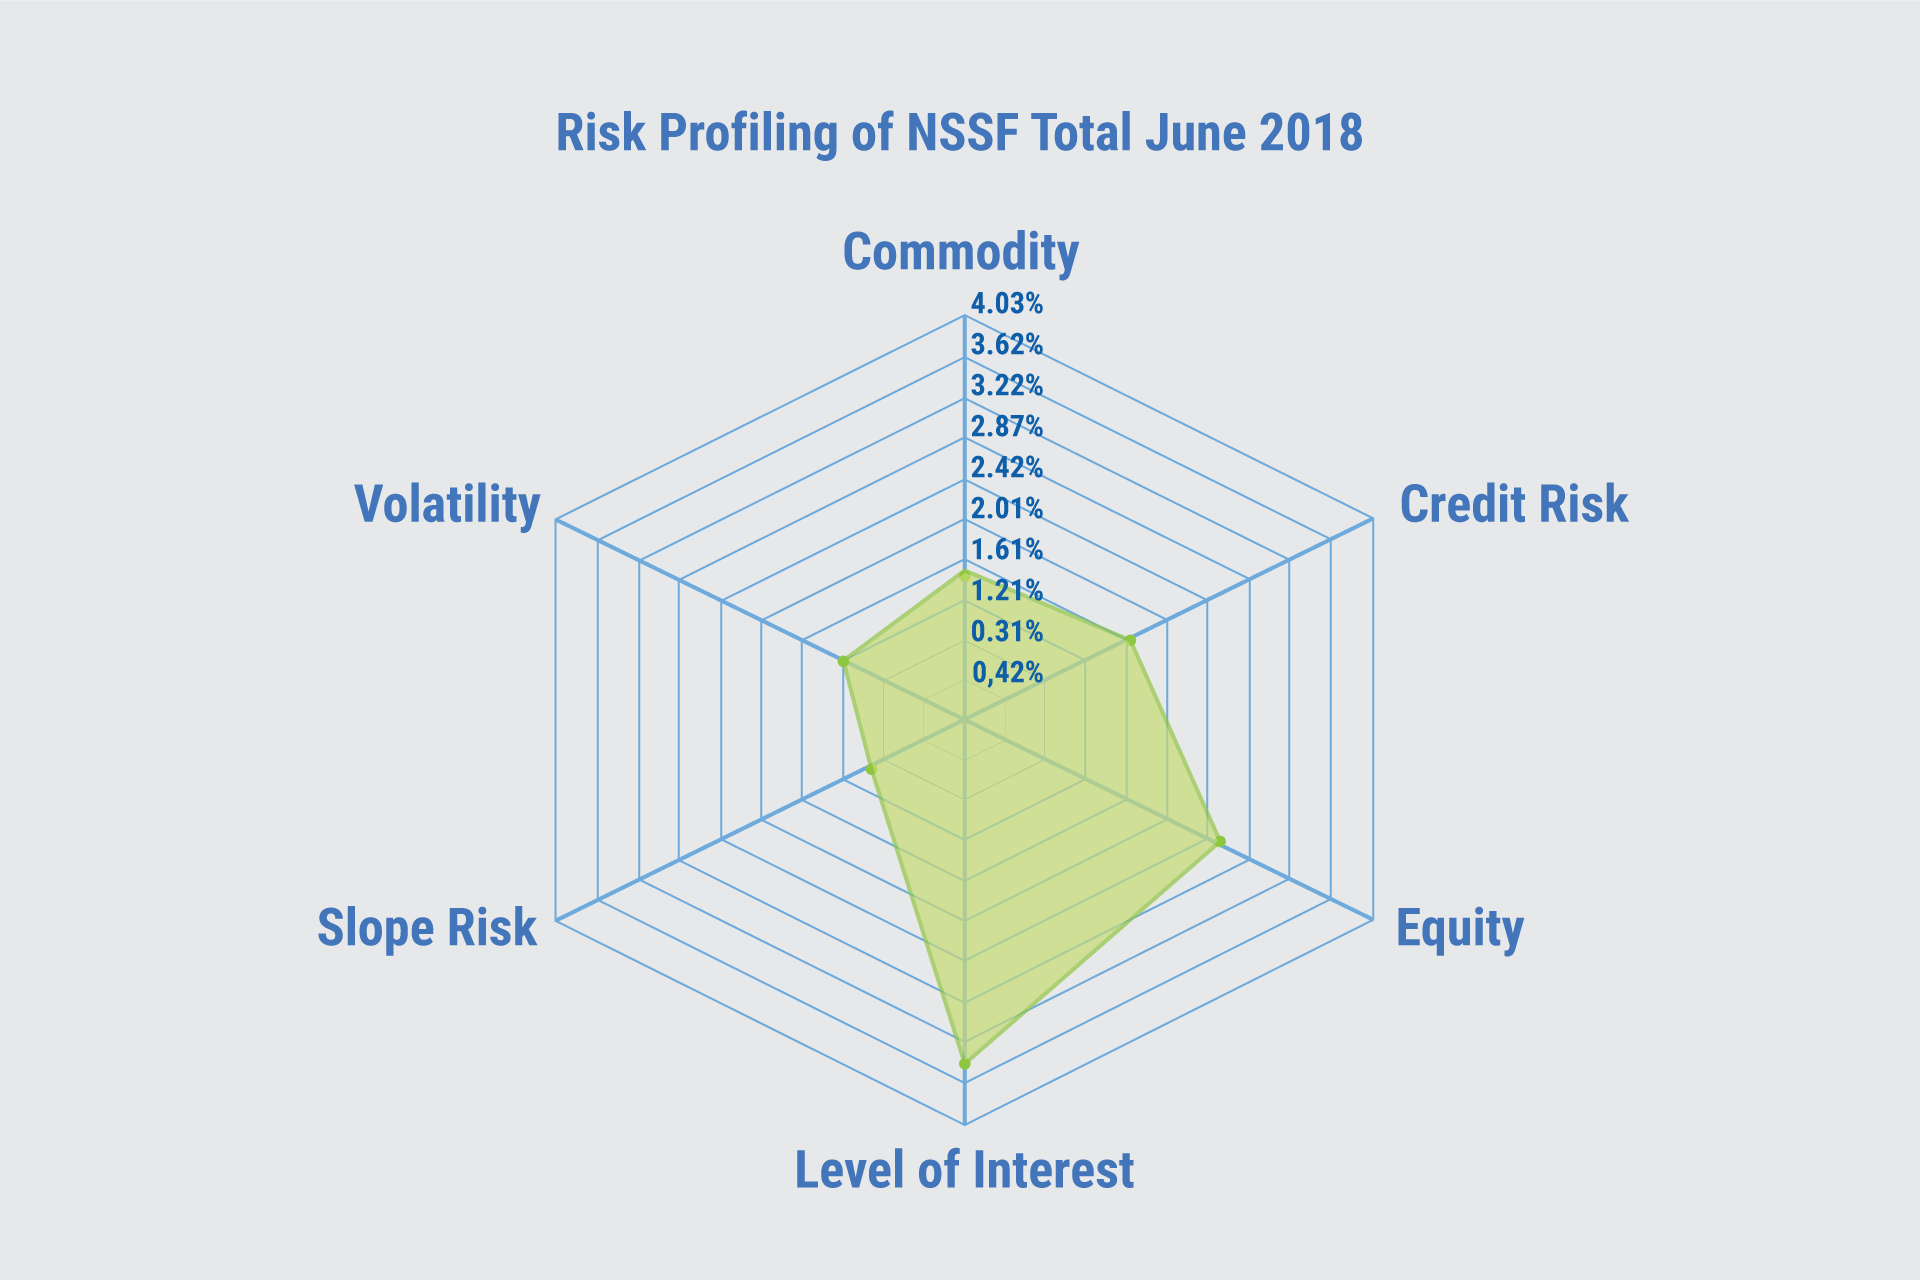
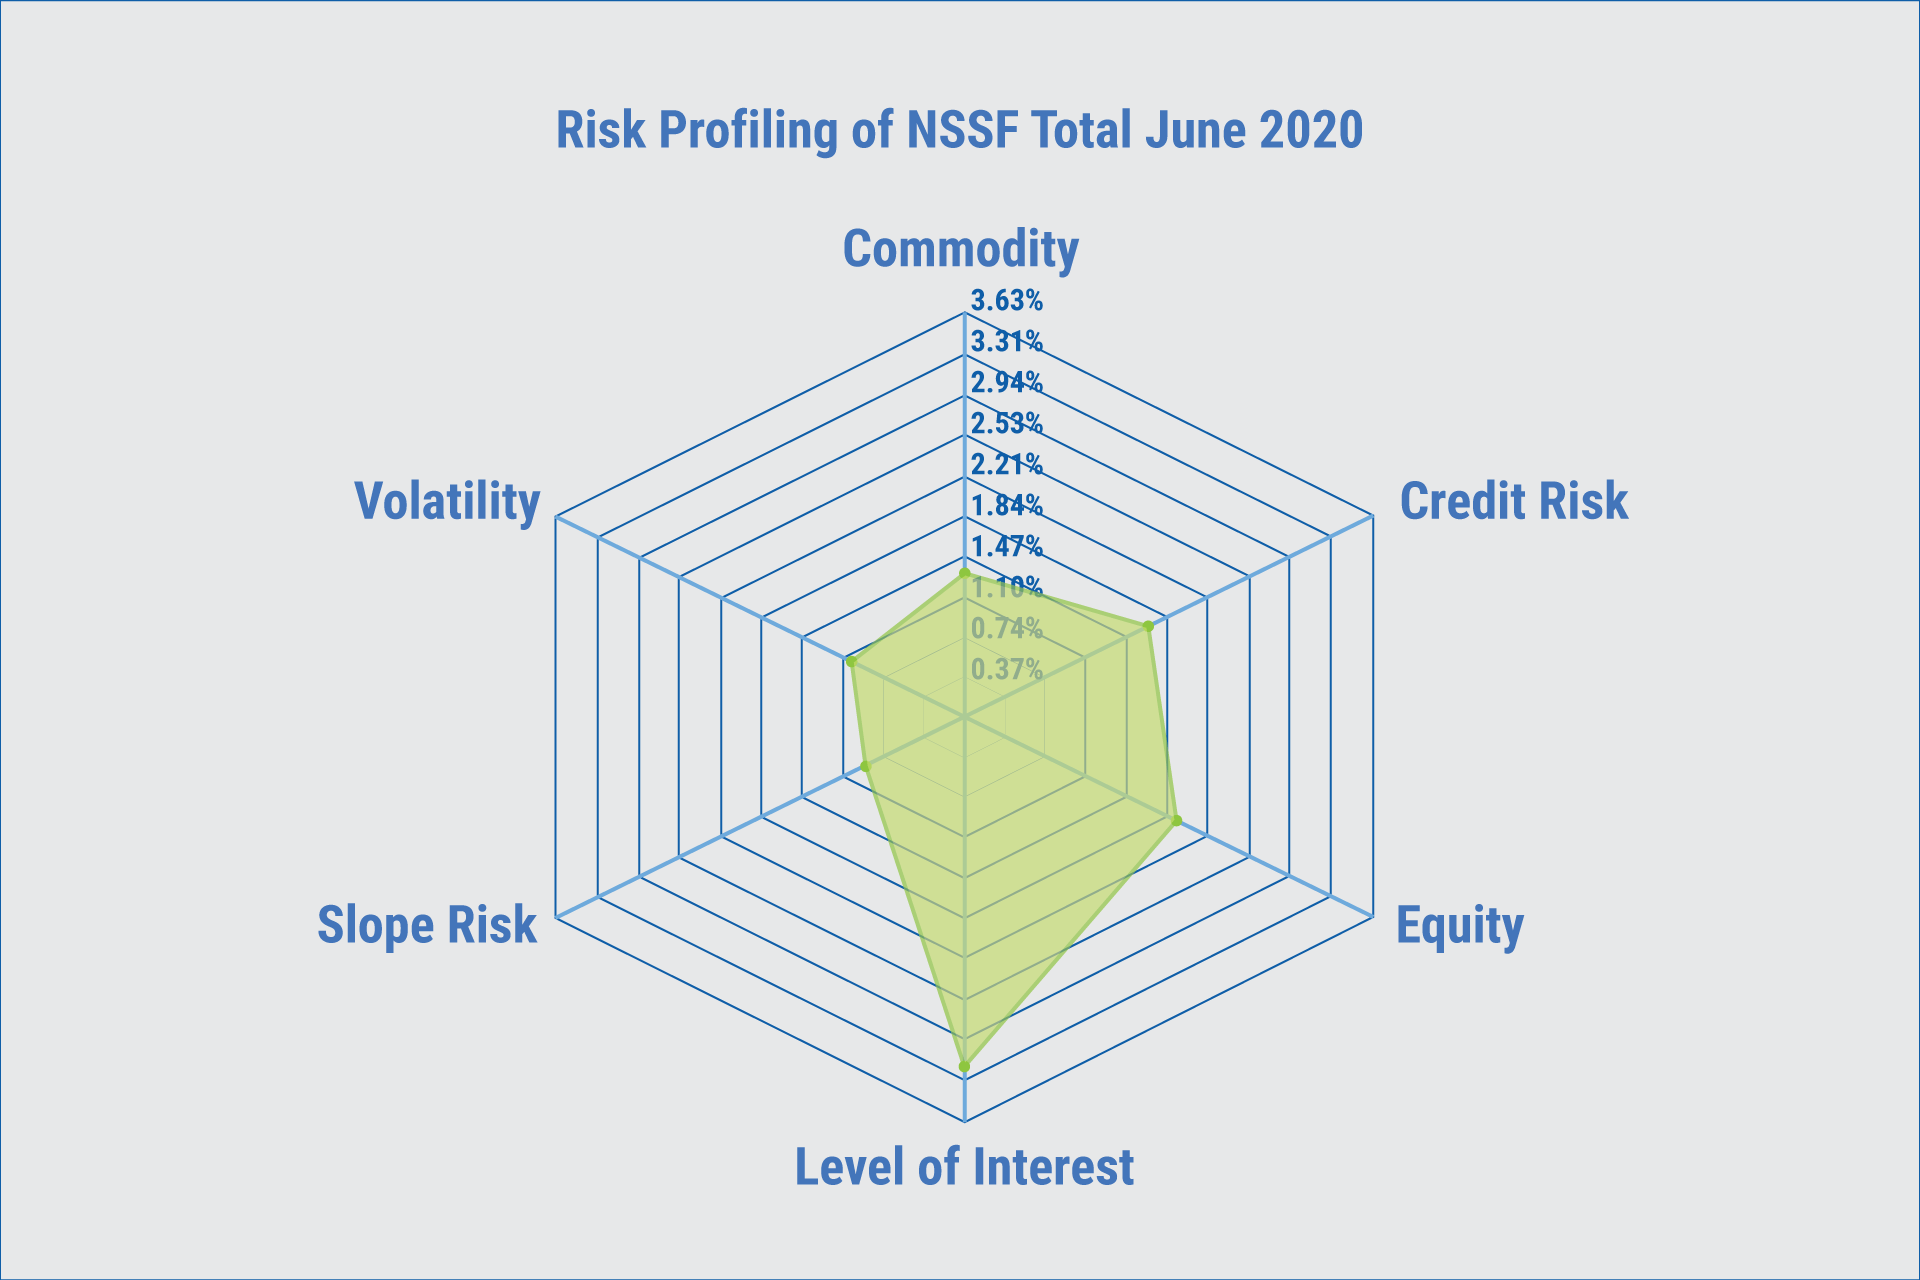
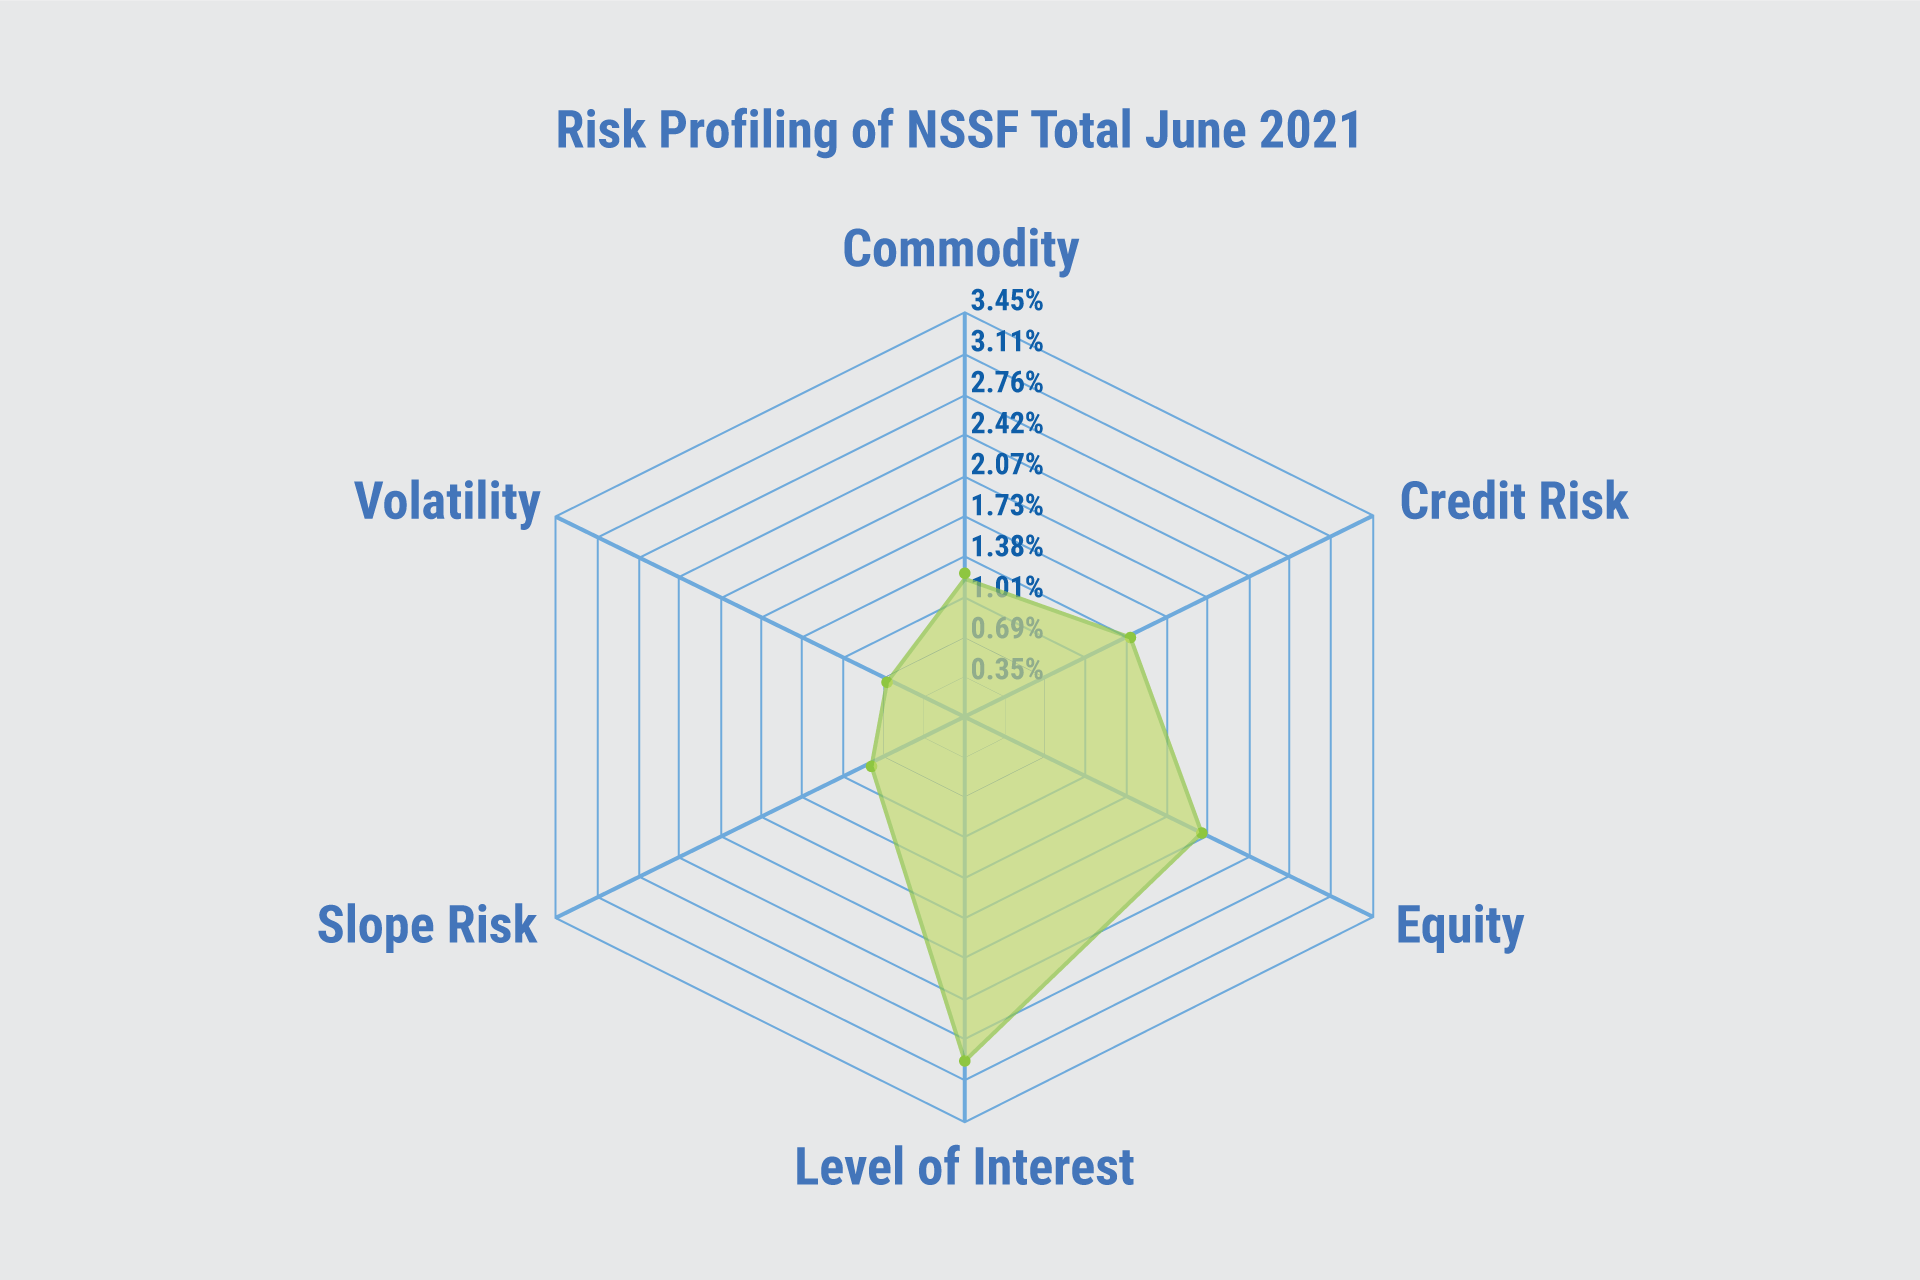
Essentially, the biggest exposure of the portfolio is the level of interest rates. This is consistent with the large allocation to fixed income and investments in interest rate sensitive stocks like financial services companies, mainly banks. The other key risk factors are market volatility, company specific factors and credit risk. Equities explain most of the volatility of the portfolio occasioned by the fundamentals of the respective companies. Uganda being a frontier market also explains commodity and credit risk being key risk factors for the portfolio.
-
Investment markets
Over the 12-month period to 30 June 2021, our portfolio assets generally performed well against a backdrop of high yields and a strong recovery of the stock markets, that offset the significant losses in currency because of a general appreciation of the Uganda shillings against regional currencies. Yet over the second half of 2020, equity markets experienced downward volatility. This shift in market sentiment was largely a reaction to global flows after Covid-19 and effects of the lockdown and its impact on regional currencies.
-
Diversification efforts
The fixed income portfolio stood at 78% of total assets while the equity and real estate portfolios stood at 15% and 7% respectively. Compared to one year ago, the allocations to fixed income and real estate declined to 78% and 7%, while equities increased to 15%. These allocations are consistent with the Fund’s preferred strategic exposures as per the SAA limits in Table 5 below.
Table 5: Asset Class Allocation
Asset Class Jun-19 Sep-19 Dec-19 Mar-20 Jun-20 Sep-20 Dec-20 Mar-21 Jun 21 SAA Fixed Income 79.46% 79.36% 78.73% 78.61% 77.25% 78.62% 78.83% 78.61% 78% 70.00% Equity 14.40% 13.22% 14.00% 13.86% 15.06% 13.80% 13.75% 13.97% 15% 22.50% Real Estate 6.14% 7.42% 7.26% 7.53% 7.69% 7.58% 7.42% 7.42% 7% 7.50% Total 100% 100% 100% 100% 100% 100% 100% 100% 100% 100.0% Source: Internal
-
Fixed income
We took advantage of opportunities in the fixed income markets both in Uganda and the region. The fixed income asset class recorded a return of 16%, a slight increase from 15.98% in the previous year. Although this is almost flat year on year, because the base is bigger, it was remarkable. Table 6 below the movement in the regional yield curves.
Table 6: Regional yield curves movements
Tenor Uganda Kenya Tanzania Jun 21 Jun 20 Change Jun-21 Jun 20 Change Jun-21 Jun 20 Change 91 day 6.90 8.71 -1.81 6.86 6.91 -0.05 3.30 2.77 0.53 182 day 8.92 10.77 -1.84 7.32 7.40 -0.08 3.57 3.30 0.27 369 day 9.84 12.38 -2.54 7.73 8.35 -0.62 5.03 4.70 0.33 2 year 11.17 13.15 -1.98 9.43 9.32 0.11 7.89 8.34 -0.45 5 year 13.28 15.28 -2.00 11.12 10.51 0.61 9.10 11.95 -2.85 7 year 13.53 14.83 -1.30 11.85 11.35 0.51 10.14 11.20 -1.06 10 year 13.93 14.38 -0.44 12.26 11.88 0.38 11.60 12.90 -1.30 15 year 14.36 14.59 -0.24 12.88 12.84 0.04 13.61 14.30 -0.69 20 year 15.33 15.33 13.27 13.17 0.10 15.41 15.79 -0.38 25 year 0.00 13.53 13.29 0.24 16.34 There was a downward shift in the yields at the long end of the curves in Uganda and Tanzania. Yields in Kenya remained relatively flat. The Fund mainly invests in the long end segment of the yield curve to match the duration of its members’ fund.
-
Equities
Figure 1.0 above highlighted a strong recovery in the stock markets. Value stocks in banks, telecoms and consumer staples recovered strongly in second half of the financial year. The relatively few listings on the Uganda Securities Exchange mean that meaningful diversification can only be undertaken regionally. But even in the region, we are limited to the blue-chip counters, something that makes timing a valuable tool. Nevertheless, the equities portfolio generated a return of 19.1%, a recovery from the 6.5% earned the previous fiscal year.
-
Real estate portfolio
We hold real estate assets to realise capital gains and earn rental income. Over 70% of this asset class comprises of undeveloped land. The strategy is to continuously work towards unlocking the value of some of the prime land through either, commercial developments for rent or sell. The entire real estate portfolio (including non-income generating assets) yielded 8% during the financial year to June 2021 which is an improvement to the 6.04% recorded last year. This return is mainly attributed to capital gains, sale of residential housing units and disposal of land.
Real estate project information update
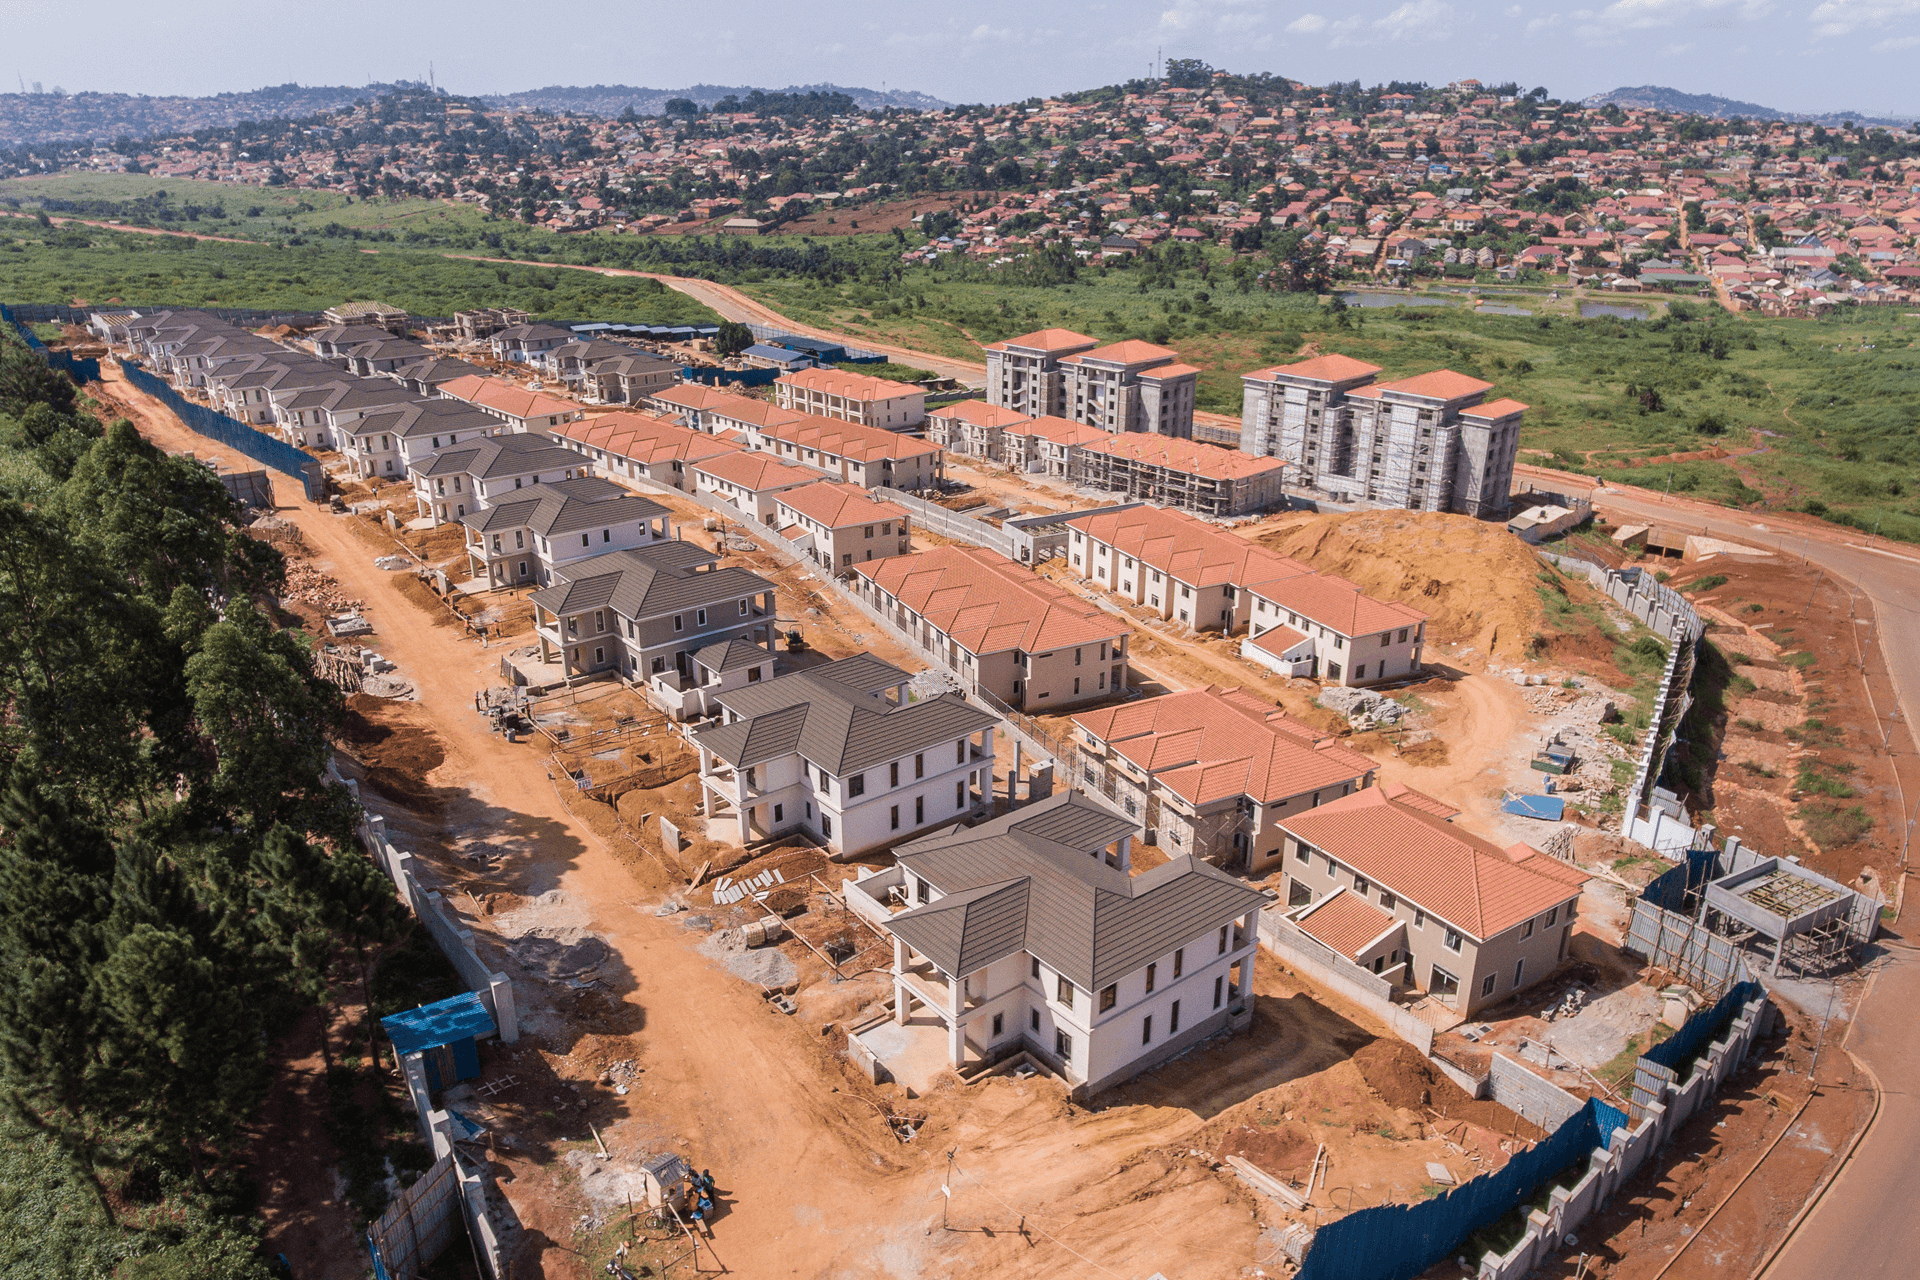
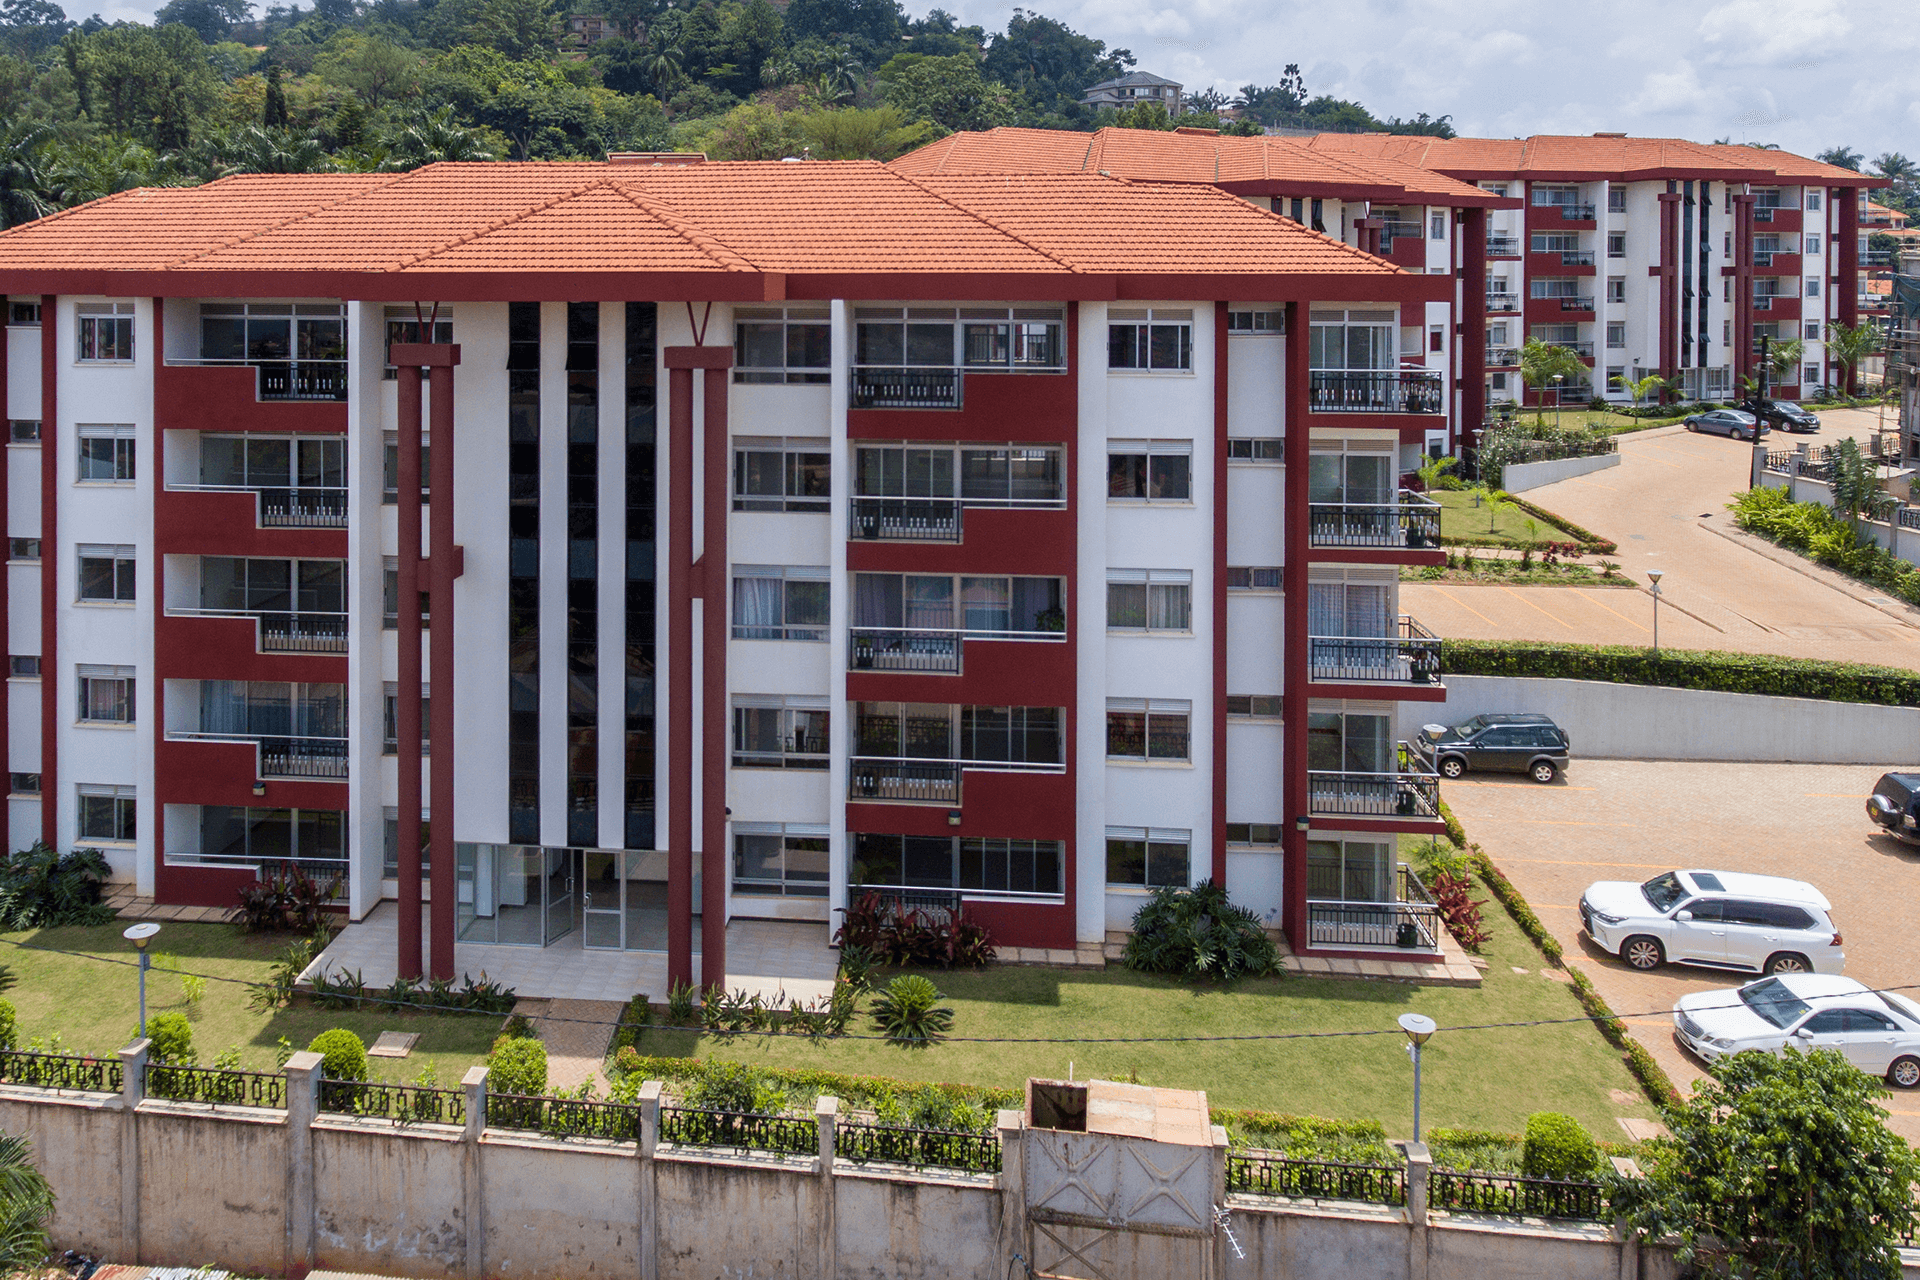
Figure 6: Lubowa housing project under construction
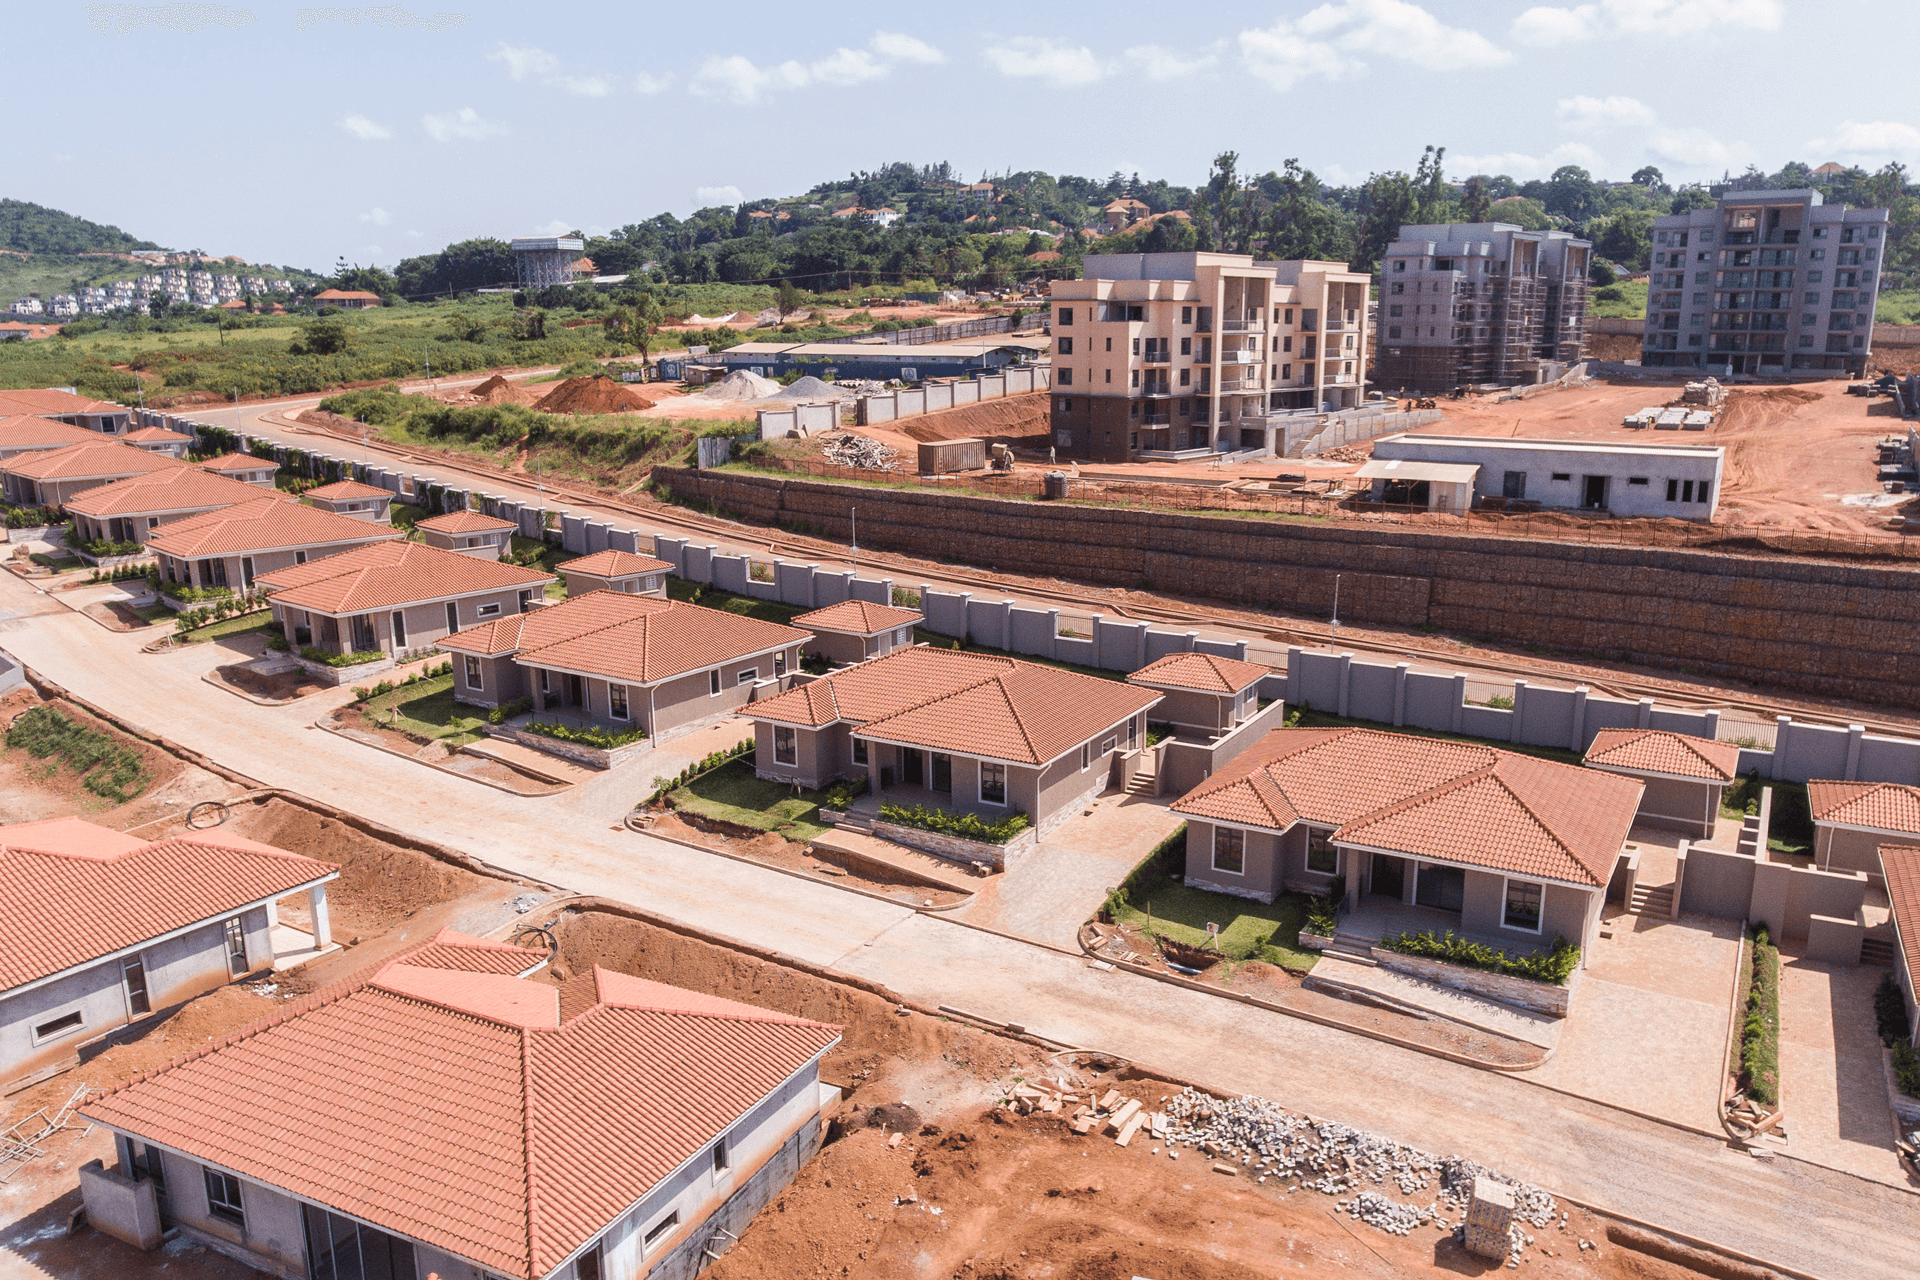
Figure 7: Lubowa Housing Project consists of bungalows, apartments, villas and town houses
Lubowa housing project
The Lubowa Housing Project is conceptualised as a self-sustaining satellite city with mixed-use housing and commercial developments on approximately 600 acres. The project is intended as a phased development with construction starting with an initial 306 housing units on 78 acres. Phase 1 will comprise of four (4) distinct house types; Apartments, Bungalows, Townhouses and Villas. It has 15 different house types.
The progress so far
Construction works for all house types are ongoing and as at 30 June 2021, the progress was estimated at 85%.
Pension Towers
Pension Towers is conceptualised as an intelligent and modern commercial complex comprising of 3 Towers (up to a max height of 32 floors) all sitting on 4 No. basement floors of parking. The total built-up area will be approximately 75,000m2 that will house office and retail space. The project has frontage on both Lumumba Avenue and Nakasero Road.
The progress so far
Construction works are ongoing and as of 30 June 2021 the progress was estimated at 67% as depicted in Figure 8.
Figure 8: Pension Towers is a mixed-use building designed to accommodate Commercial, Offices, Services and Parking for 500 cars on the basement floors.

FY 2021/2022 outlook
We intend to continue with portfolio rebalancing. For the fixed income asset class, this will be done by way of corporate bonds and structured products and we will seek for more diversification opportunities within Uganda and the East African region.
In the equity asset class, we will explore opportunities in all the markets where we invest. Private equity also remains high on our radar.
In real estate, the strategy is to continuously work towards unlocking the value of some of the prime land through either undertaking commercial and mixed-use developments for renting out or building residential houses for sale. 70% of the real estate class is comprised of undeveloped land. Developing the land is one of the ways of unlocking the accumulated value over time. Consequently, we expect that in the financial year of 2021/2022, the Lubowa and off taker project in Kyanja will be completed. We also expect the commencement of works on Gulu, Mbale and Temangalo projects and progress at the Pension Towers Project.